1 min read
Collecting data as a clinician-researcher
By Tak Tsun (Edmund) Lo — psychologist and researcher (NL/HK). Get in touch.

I’ve always been envisioning enhancing psychotherapy with data and tools. A few months after resuming being a practicing psychologist, I’m finally collecting some data for myself and the clients I see.
Long-story-short, I record after every session on what I’ve noted in terms of emotion, “markers” (i.e., sets of client presentations that correspond to therapeutic tasks which may help), and simple questions that allow myself to track the treatment progress: (a) how many sessions do I expect we still need? (b) client’s functioning; and (c) client’s distress. It allows me to review what I’ve done instead of relying on my intuition or long-dated recall.
Curious about what I will find in a few weeks/months!
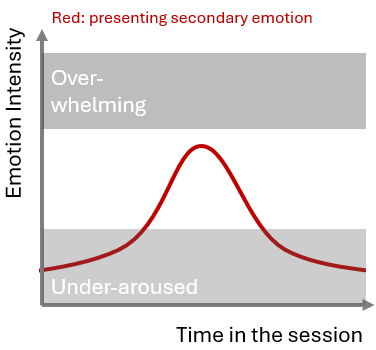
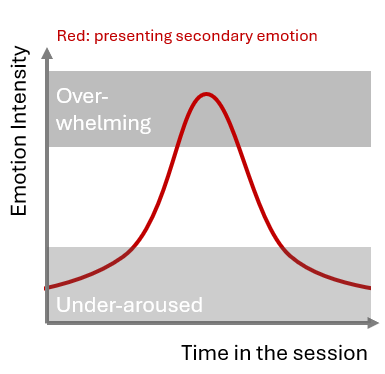
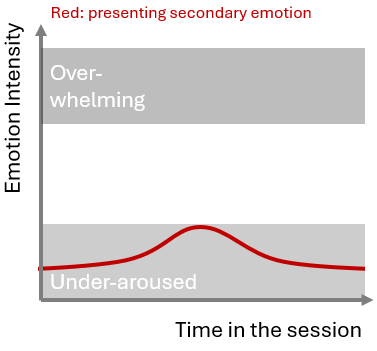
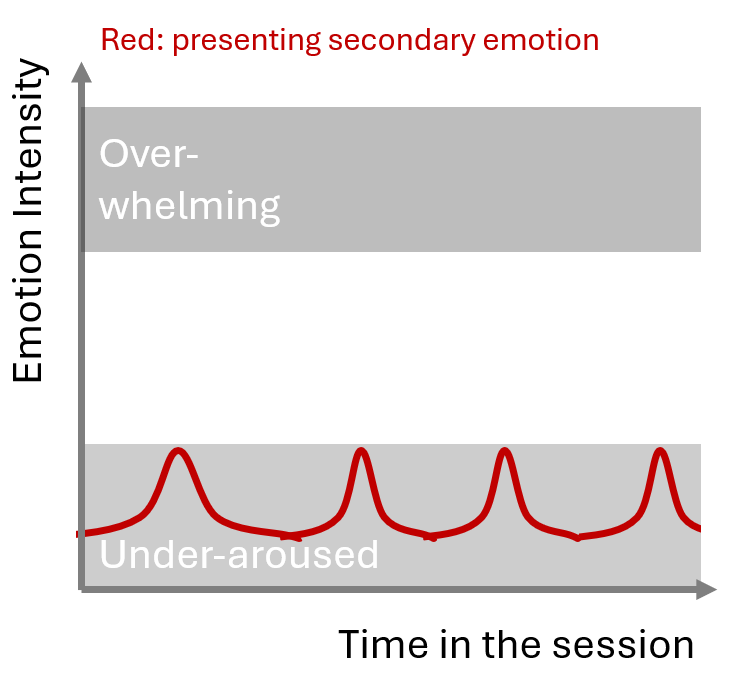
A teaser below: multiple choices that I give myself, “which best describes client’s emotion in the session just now?”